
Configuration tells you what should be true. Access logs tell you who touched it. Monitoring tells you what is actually happening — and when something breaks, it tells you before your customer does.
Keycyte MON watches your network devices, servers and services on one platform. It runs on your own servers and needs no outbound connectivity.
In most organisations, monitoring looks like this:
The network team’s tool, the systems team’s tool and the security team’s tool tell three different stories about the same outage. The first half hour of the incident call goes on deciding which one is right.
Every device needs a template chosen, every metric a threshold typed, every profile assigned by hand. The project finishes and nobody wants to touch it again.
The customer calls to report the outage. When it started, how many people it hit and how long it lasted are all reconstructed afterwards, from memory.
Government, defence, energy, manufacturing. Data leaving the organisation is not a preference — it is forbidden. Most modern monitoring products either cannot work under that constraint or work half way.
In three sentences:
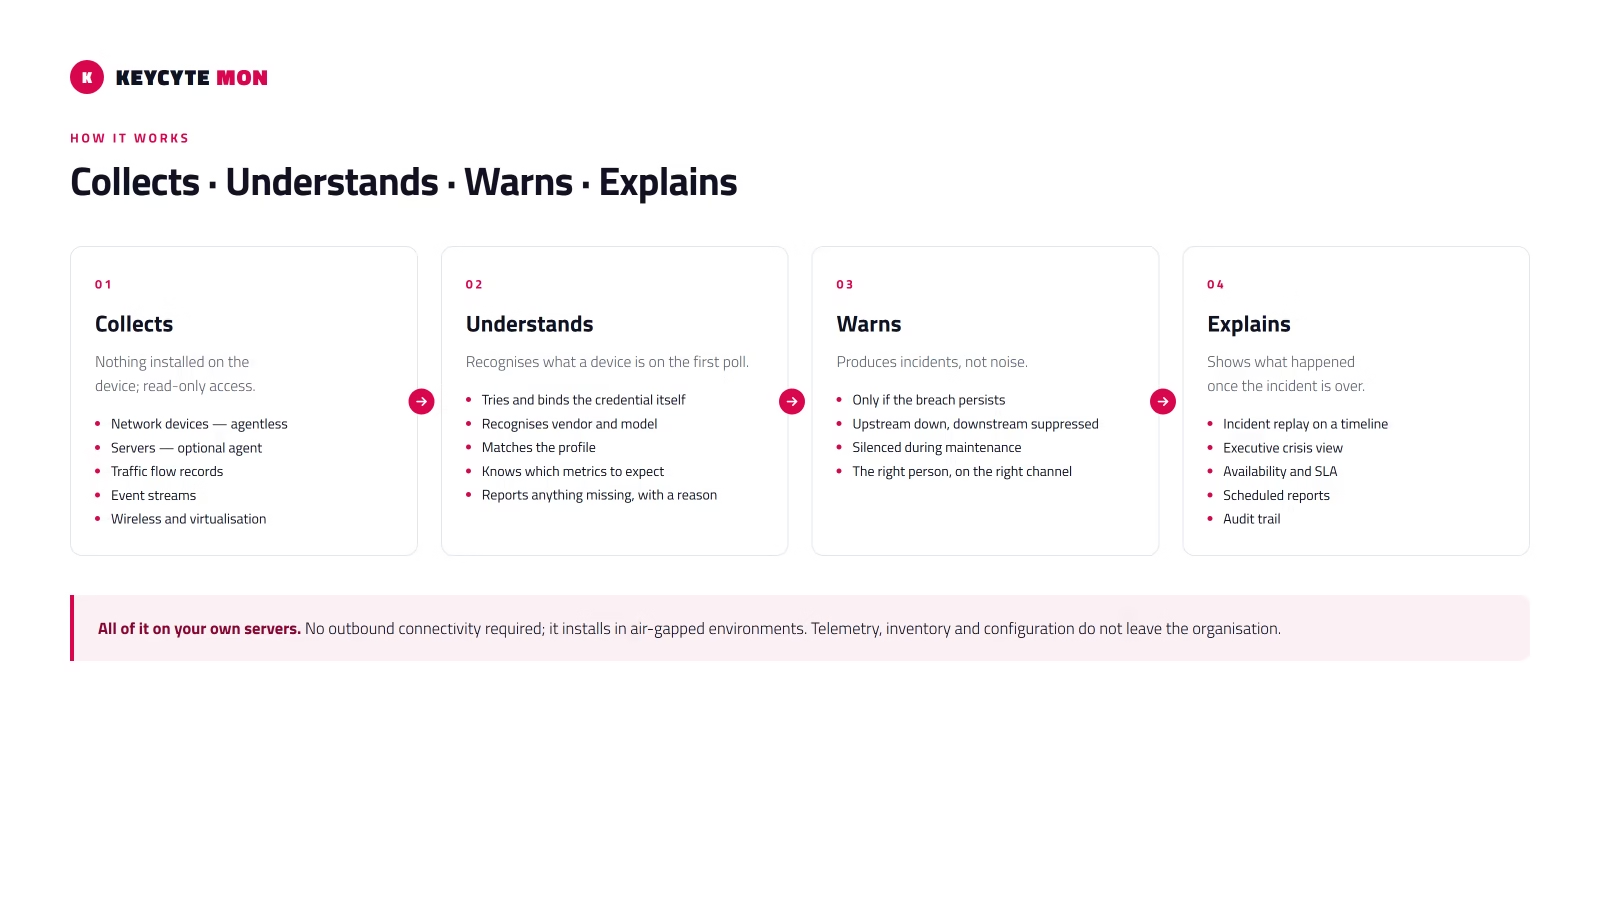
Polls network devices without installing anything on them, takes host data through an optional agent, and listens to flow records and event streams.
Recognises what a device is on the first poll, knows which metrics to expect from it, and reports anything missing with a reason.
Notifies the right person on the right channel when a rule is breached, and replays what happened on a timeline once the incident is over.
Add the device. The rest happens on its own.
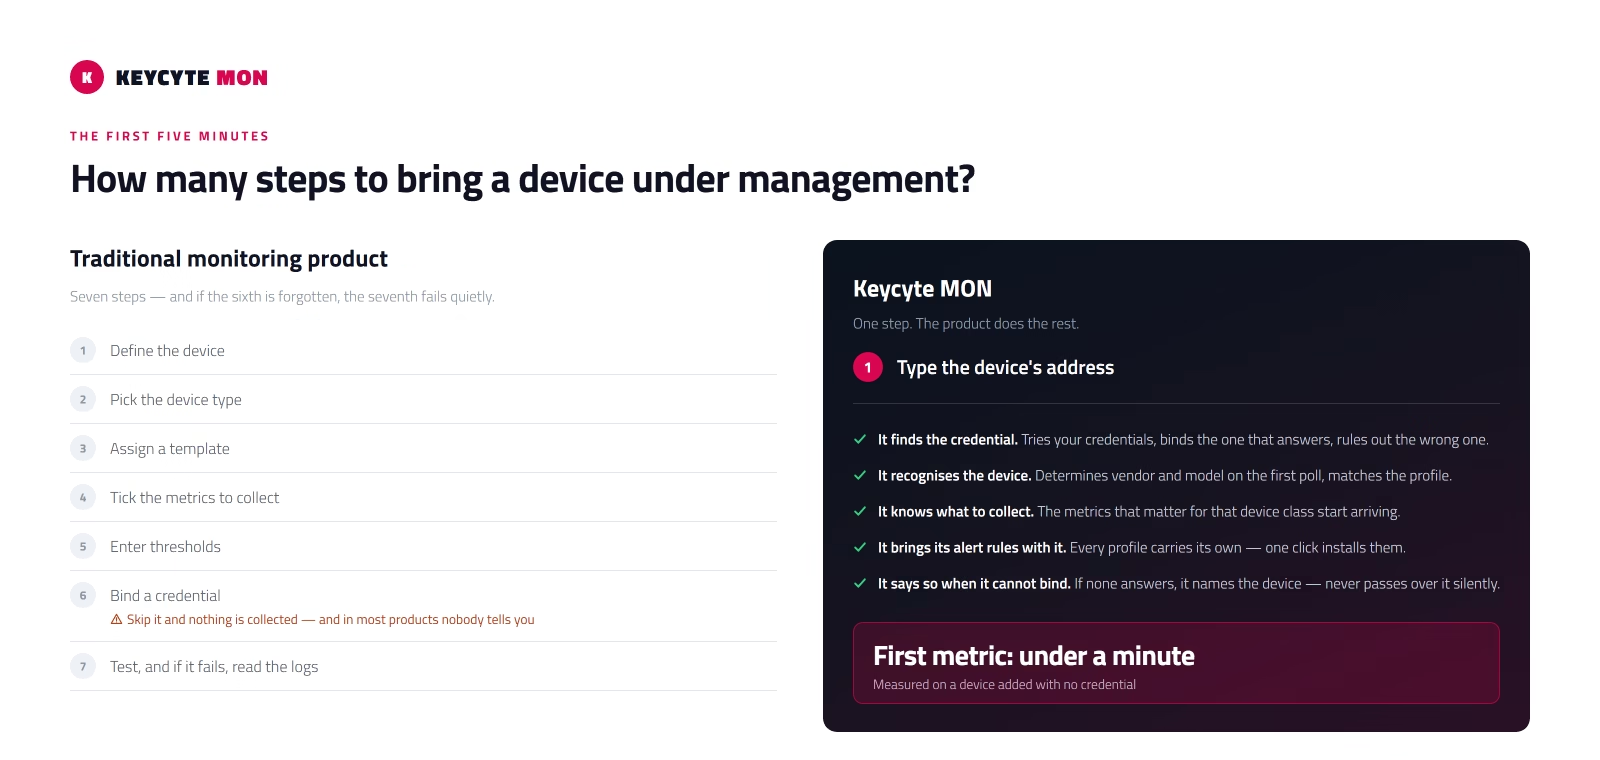
In a traditional monitoring product, bringing a device under management means: define the device → pick its type → assign a template → tick the metrics to collect → enter thresholds → bind a credential → test. Seven steps, and if the sixth is forgotten the seventh fails quietly.
Keycyte MON has one step: type the device’s address.
After that the product does the following by itself:
You do not have to choose one. The server tries the SNMP credentials defined in your organisation and binds the one the device answers to. It rules out the wrong one, records the right one, and never asks again. If none of them answers, it does not pass over it silently — it names the device it could not poll.
On the first poll it determines the vendor and model and matches the right monitoring profile. No template picking, no hunting through a tree, no deciding whether this is a switch or a router.
As soon as the profile matches, the metrics that matter for that class of device start arriving: interface counters, errors and discards, temperature, processor and memory, session counts — whatever the device offers.
Every profile carries sensible alert rules for its device class. One click installs them; leave them out if you prefer.
First metric: under a minute
Measured on a device added with no credential at all.
Everything the operations team needs during the day, in one interface.
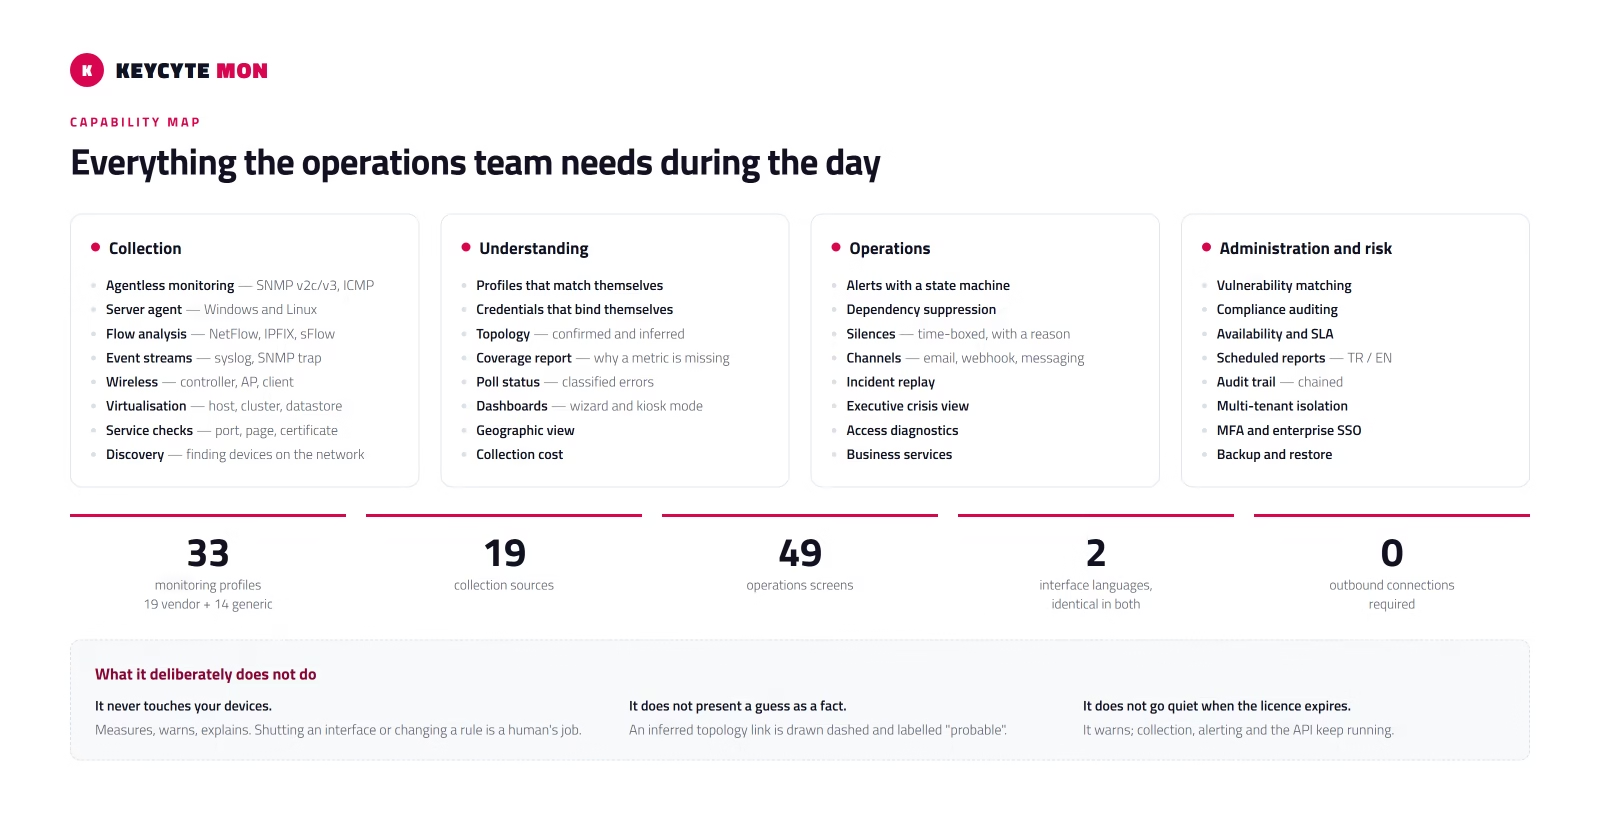
Agentless network monitoring. SNMP v2c and v3, ICMP reachability. Nothing is installed on the device; read-only access is enough.
Server and host monitoring. An optional agent for Windows and Linux hosts: processor, memory, disk, service state and event logs.
Flow analysis. NetFlow, IPFIX and sFlow records — who is talking to whom, which application is filling the link, which sources generate the most traffic.
Event streams. Syslog and SNMP trap listeners; incoming events can be bound to rules and turned into alerts.
Wireless. Controllers, access points, connected clients, session history and wireless event logs.
Virtualisation. Host, cluster and datastore metrics from your virtualisation platform.
Service checks. A port that should be open, a page that should respond, a certificate that should not have expired — service health independent of device metrics.
Topology. Confirmed adjacencies from neighbour discovery protocols, plus links inferred from switch forwarding tables. The two are drawn differently: an inferred link is dashed, because it is described as probable, not certain. Devices are grouped by location, and the page states plainly which nodes are past their freshness window and which name resolves to two devices.
Coverage report. The metrics expected from a device beside the metrics that arrived, and for each one missing, a reason: no credential bound, no profile matched, poll failed, agent not installed, device does not support this object. “Why is this graph empty” is answered on screen, not guessed.
Poll status. For every device and every source, the last attempt: when, how long it took, how many samples were written, and if it failed, a classified error. A timeout is not a credential failure, and the product does not conflate them.
Dashboards. Drag-and-drop dashboard design and a three-step wizard: pick the devices, pick the metric family, pick the chart type — get a populated dashboard. Kiosk mode for wall displays.
Geographic view. A province-level status map for multi-site organisations.
Alerts with a state machine. Breaching a threshold does not raise an alert immediately. It enters a “pending” state and becomes “firing” only if it stays there for the duration you set. A momentary spike does not wake anyone at 3am.
Dependency suppression. When an upstream device fails, the thirty devices behind it failing is one incident, not thirty-one. Where the parent relationship is defined, the downstream alerts are suppressed.
Silences. Planned maintenance, a known fault, work in progress — time-boxed and with a stated reason.
Channels and notification. Email, webhook and messaging channels, with rule-level routing for which alert reaches whom.
Incident replay. Step through a closed incident on a timeline: when it started, how each metric moved, what the neighbours were doing.
Executive crisis view. A read-only situational display: what is affected, how badly, for how long, and who should look where. Not a debugging screen — the one you put on the meeting room wall.
Access diagnostics. “We can’t reach that address” measured step by step instead of argued about.
Vulnerability matching. Known vulnerabilities matched against the vendor and version of the devices in your inventory, ordered by real risk rather than raw severity.
Compliance auditing. Configuration and state checks against your own policy.
Availability and SLA. Service level measurement — with a defined denominator. An SLA percentage whose basis is unclear is not a number, it is a feeling.
Scheduled reports. Periodic reports produced and delivered to the people who need them, in Turkish or English.
Audit trail. Who changed what and when, chained so that later tampering is evident.
Collection cost. Which profile produces how many series, and which device is eating the collection budget. A single misconfigured profile inflating the system is the quietest failure a monitoring product has; here it is visible.
Multi-tenancy. Every record belongs to an organisation and every query filters by it. Real isolation for service providers and group structures.
Role-based access. Who can see what, and who can change it.
Multi-factor authentication and enterprise SSO. MFA, and single sign-on through your identity provider.
Encrypted secrets. Device credentials, tokens and webhook addresses are not stored in clear text.
Backup and restore. Scheduled backups, and verification that the backup can actually be restored.
The installation package is copied to your server and installed with a single command. Secrets are generated on the target machine during installation — there is no password in the package, so no two customers share one.
When the script finishes it does not simply say “done”. It checks that the system is up, that the interface answers, that the running build is the one in the package, and that the licence is valid. If any of those fails it exits with an error and leaves the system up for you to inspect.
It installs in air-gapped environments. The vulnerability database needs either a one-off transfer window or an offline package; nothing else leaves the building.
One server is enough for a small deployment. For sites on separate networks, edge collectors report to the centre over a secure channel.
Keycyte MON measures, warns and explains. Shutting an interface, changing a rule, restarting a device — a human does those. A product that reaches into the network on its own judgement at 3am creates more problems than it solves.
Adjacencies derived from forwarding tables are drawn dashed and labelled probable. A topology that presents a guess as a fact leads you to blame the wrong device.
A permanent banner appears in the interface; collection, alerting and the API keep running. A monitoring system that stops because a date passed takes your visibility away exactly when you need it most.
Your telemetry, configuration and inventory stay on your servers. That is not a setting — it is the architecture.
Free monitoring tools collect, but leave coverage, credentials, alert discipline and reporting to you. Three months in, nobody wants to touch the templates. Keycyte MON works on the day it is installed, and keeps working.
Where data cannot leave the organisation, cloud is not an option. Keycyte MON was designed for that constraint from the start: air-gapped is not a deployment variant, it is the default.
Access, configuration and monitoring from the same vendor, the same support team and the same contract.
Keycyte NCM manages configuration, Keycyte PAM manages access; Keycyte MON shows you the live network running on top of both.
The package is copied to your server and installed with a single command — a few minutes. If the real question is “when do I see data”, the answer is shorter: after you add the first device, metrics start arriving within a minute. No templates to assign, no thresholds to type, no profiles to pick.
On network devices, no. Switches, routers, firewalls and wireless controllers are monitored over standard management protocols with read-only access.
For Windows and Linux servers there is an optional agent, which collects what can only be seen from inside the machine: processor, memory, disk, service state. If you would rather not deploy it, you don’t — those servers are then monitored to the extent the network can see them.
No. The product installs and runs in air-gapped environments. The one exception is the vulnerability database: keeping it current needs either a one-off transfer window or an offline update package. Nothing else leaves the building.
On your own servers. Telemetry, inventory, configuration and credentials do not leave the organisation. That is not a setting — it is the architecture.
The architecture grows sideways: edge collectors report to the centre for sites on separate networks. In practice the limit is the hardware you give it. The product also shows you its own collection cost — which profile produces how much load — so you can see when it needs to grow rather than guess.
Very probably. Vendor profiles collect deeper data from recognised devices, but the generic profiles collect interface, system and resource metrics regardless of vendor. A profile can be added for a device class specific to your estate.
Three mechanisms exist to prevent exactly that:
The product answers that before you ask. The coverage report puts the metrics expected from each device beside the ones that arrived, and gives a reason for each one missing: no credential bound, no profile matched, poll failed, agent not installed, device does not support this data. The poll status screen shows when the last attempt happened and what class of error it hit.
In most monitoring products the answer to this question is in a log file. Here it is on the screen.
No, and that is a deliberate decision. Keycyte MON measures, warns and explains. Shutting an interface, changing a rule or restarting a device is a human’s job. A product that reaches into the network on its own judgement at 3am creates more problems than it solves.
A permanent banner appears in the interface. Collection, alerting, notification and the API keep running. A monitoring system that goes quiet because a date passed takes your visibility away exactly when you need it most. The warning also begins 30 days out, not on the last day — a week’s notice is shorter than a commercial renewal takes, so it helps nobody.
Yes. Notifications go to email, webhook and messaging channels; a webhook can carry alerts into your own ticketing or incident management system. Sign-in can go through your enterprise identity provider. Everything behind every screen is also available programmatically.
Yes. Every record belongs to an organisation and every query filters by it — real isolation for service providers and group structures. One organisation’s operator cannot see another’s data.
Yes. The three products work independently. Bought together, the chain from “what happened” to “what changed” to “who did it” closes on one platform — but that is an option, not a requirement.
By the size of the estate and the number of devices monitored. A time-limited POC licence is issued for evaluation, with the whole product unlocked. Get in touch and we’ll size it to your needs.
One package and one command. Add a device, watch the metrics arrive inside a minute. If it is not for you, removing it is one command too.
Request a Demo Contact Us